What to Watch in an Axe Throwing Dashboard
The views owners can use when reviewing lanes, staffing, pricing, leagues, and customer activity.
Blade resources / FIELD
What to Watch in an Axe Throwing Dashboard
Why this matters
A practical guide for owners comparing booking, front-desk, lane, league, customer, and reporting workflows.
Quick takeaways
Dashboards should show what is booked, what remains available, and what has changed over time.
Lane-level views give operators more context than venue-wide totals alone.
Marketing, scoring, and booking data are stronger when they live together.
01
A useful dashboard answers three questions
Which lane inventory is booked, which shifts have open capacity, and how current activity compares with prior periods. Those questions make the dashboard useful during planning.
Axe throwing venues need visibility that stays tied to real operational units: lanes, dayparts, session types, leagues, memberships, and repeat visits.
02
Look for views that change decisions
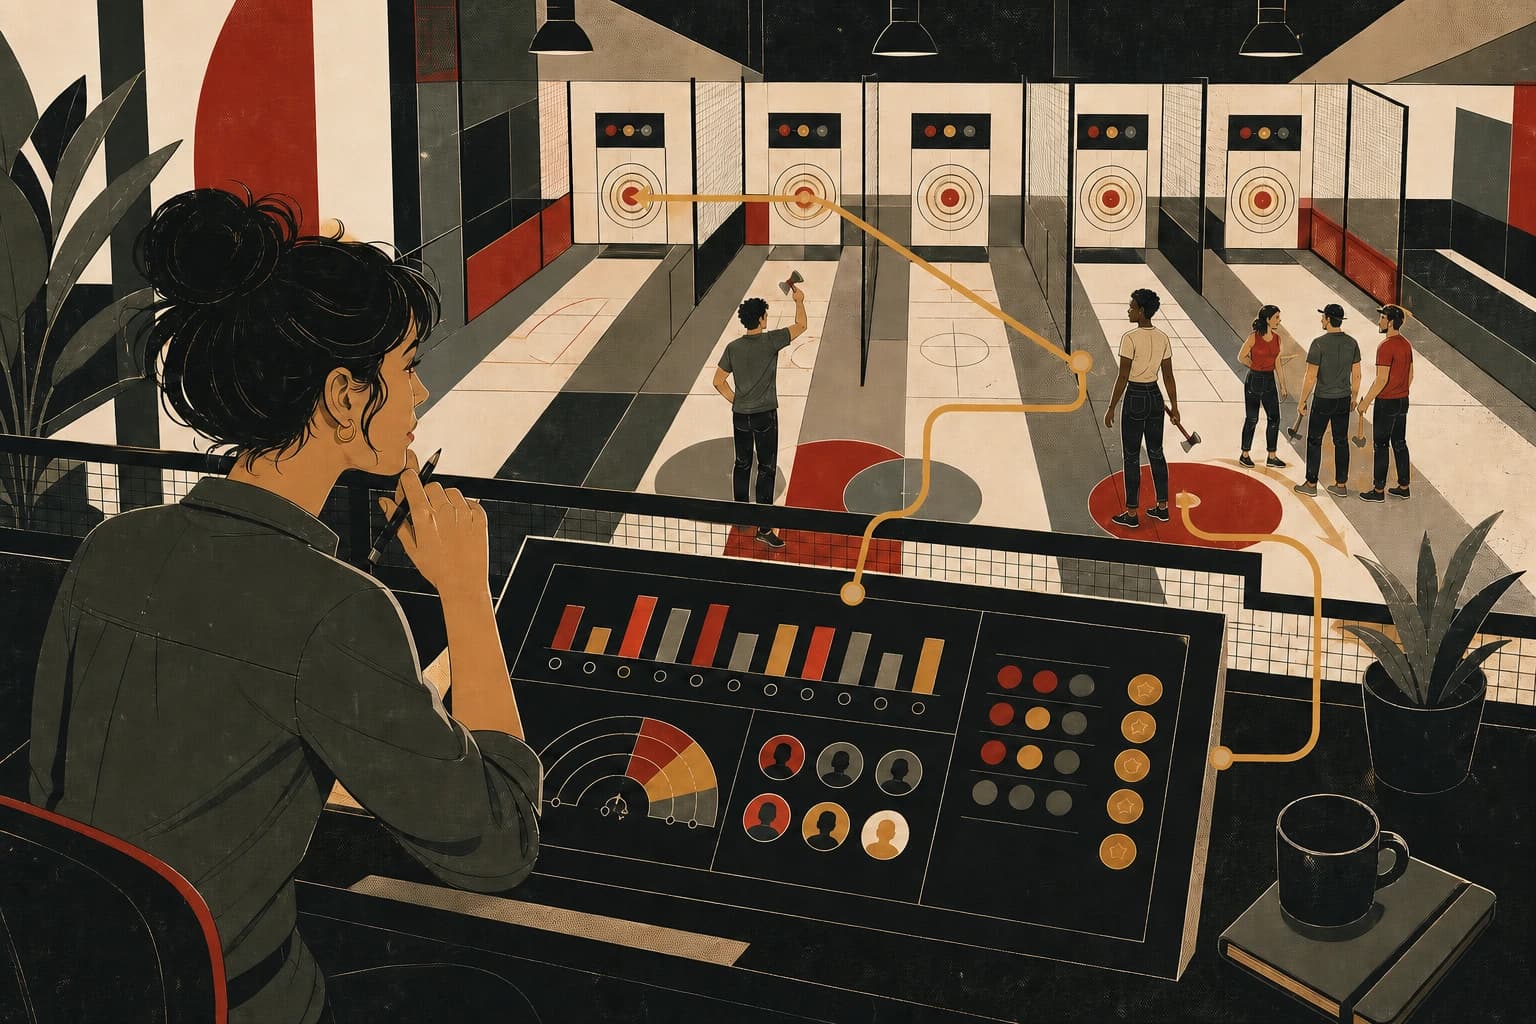
Owners may need to see occupancy by lane, revenue by daypart, waitlist activity, league activity, membership changes, and promotion use. These views provide context for pricing, staffing, and programming decisions.
A connected platform keeps the underlying bookings and operational records close to the report.
03
Connect customer history with venue activity
Booking data alone does not show scoring history, customer profiles, loyalty activity, or which offers a customer has used. Those records are more useful when they are available beside revenue and booking reports.
That connection helps owners see what sold, which customers have returned, and which programs or offers they have used.
More guides for axe throwing operators.
Each article focuses on a specific buying or operating decision: booking, lane use, check-in, scoring, leagues, or reporting.
Blade resources / 01
How to Choose Axe Throwing Booking Software
What owners should compare before they swap booking tools for their axe throwing venue.
Blade resources / 02
How to Fill Empty Lanes Without Discounting Everything
A practical look at happy hour, plan-and-save, dynamic pricing, and waitlist strategy for axe houses.
Blade resources / 03
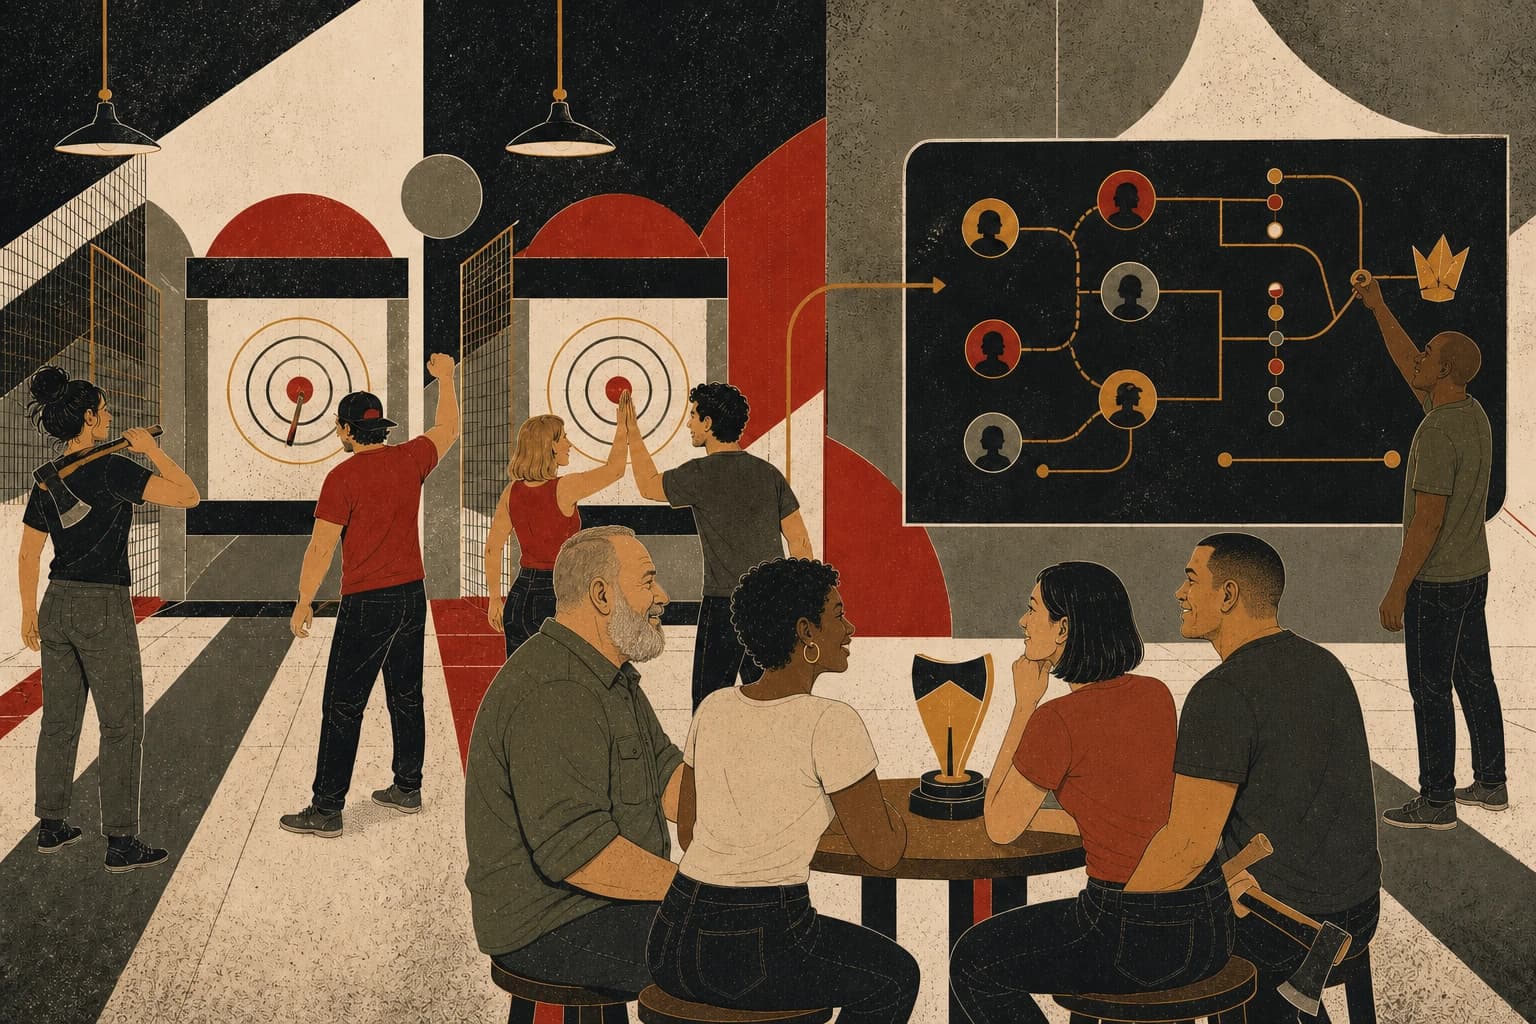
How to Run Leagues and Tournaments Without Spreadsheets
How to manage scoring, standings, brackets, player records, and bookings in one league workflow.
Blade resources / 04
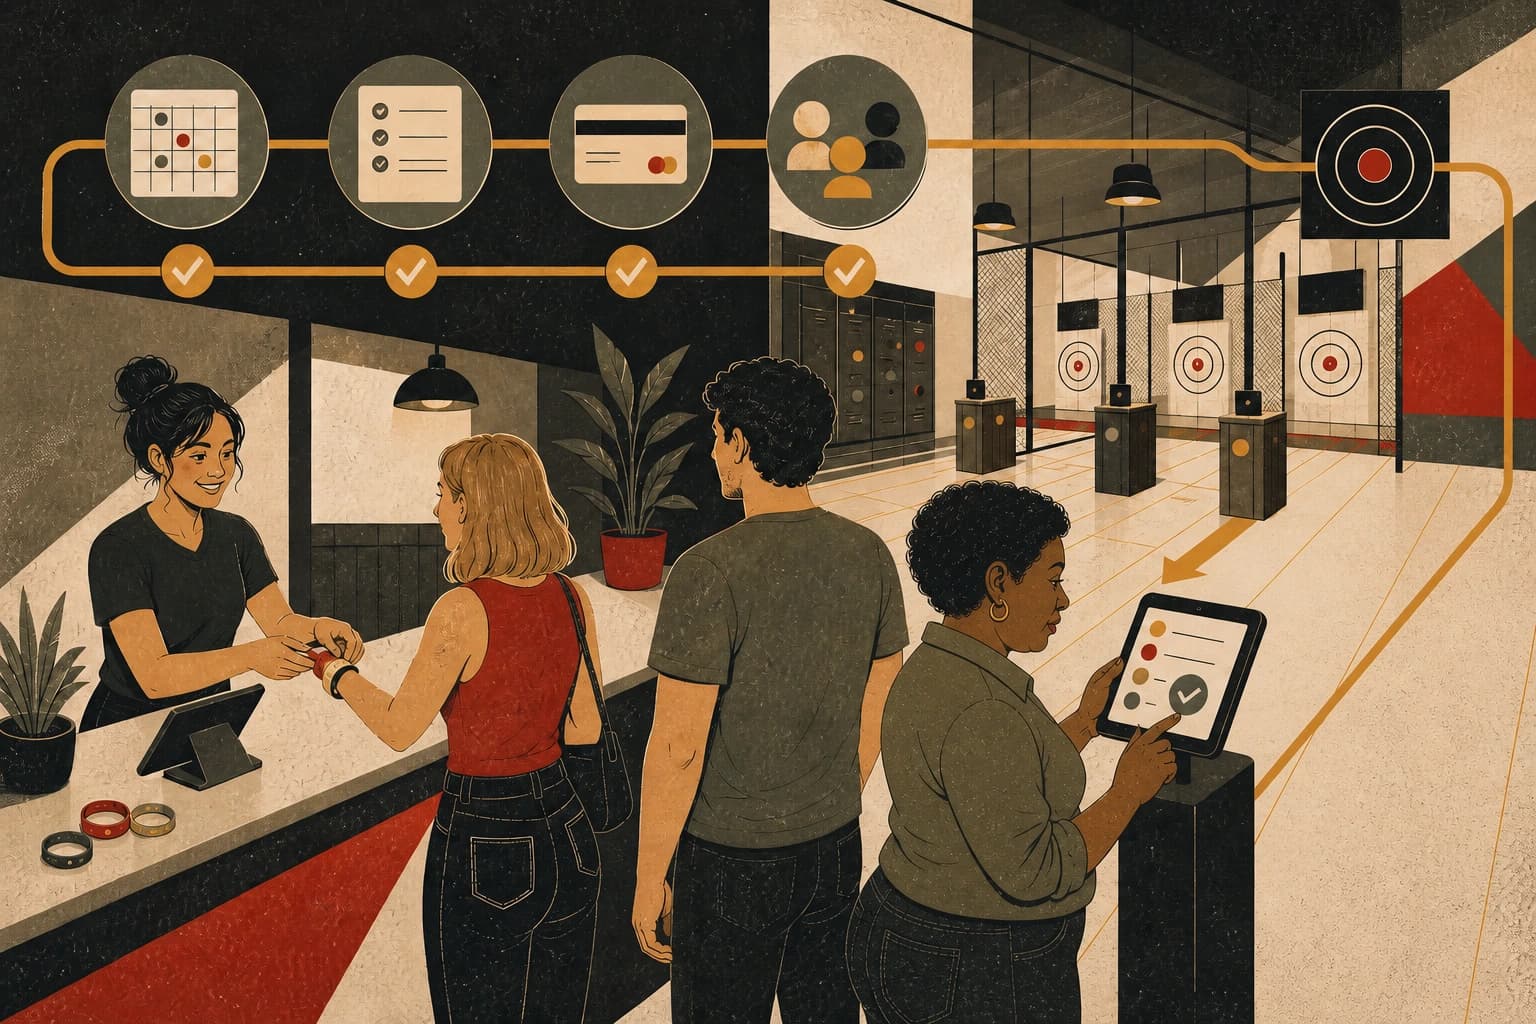
How to Speed Up Waivers and Check-In at the Desk
How venues can cut lobby friction before a busy shift turns into a queue problem.
See how Blade handles this across the venue.
Compare your current process with Blade’s connected workflow for booking, scoring, check-in, customer records, and reporting.